
Here’s something that surprises most store owners. Ecommerce emails get opened less than almost any other industry. The average open rate for ecommerce sits around 29.81%, while non-profits see 40% and education brands see 35%. If you only looked at that one number, you’d think your store was doing something wrong.
It isn’t. People don’t open store emails out of curiosity. They open them when the offer actually matters to them. That one fact changes how you should be reading your numbers, and it’s exactly why most “email marketing metrics” guides online get it wrong. They hand you a flat industry average and tell you to hit it, without explaining what’s normal for a store like yours and what genuinely needs fixing.
This guide is different. We’ll walk through every metric worth tracking, what’s actually normal for ecommerce in 2026, where your numbers should sit compared to other industries, and what to do the moment a number falls short. Along the way, you’ll see real examples from Shopify and WooCommerce stores, plus where a platform like Adflipr fits into making these numbers move in the right direction.
Why Email Marketing Metrics Matter More Than They Get Credit For
Think of your email metrics as an early warning system. A dip in click rate this week often shows up as a sales dip next week. A creeping unsubscribe rate this month usually means your list is getting tired of hearing from you the same way, too often, or about the wrong things.
The stores that grow steadily aren’t the ones with the best looking numbers. They’re the ones who check these numbers often enough to catch small problems before they turn into expensive ones.
This is also the thinking behind how Adflipr approaches reporting. Most platforms show you opens and clicks and stop there. Adflipr’s analytics and reporting dashboard goes a step further and ties every campaign back to actual revenue, so you’re not just watching engagement, you’re watching what it’s worth.
See How Your Industry Actually Compares
Before you panic over a number that looks “low,” check it against your real industry, not a flat average pulled from every business type combined.
| Industry | Avg. Open Rate | Avg. Click Rate | Unsubscribe Rate |
|---|---|---|---|
| Business + Finance | 31.35% | 2.78% | 0.15% |
| Non-Profits | 40.04% | 3.27% | 0.18% |
| Education + Training | 35.64% | 3.02% | 0.18% |
| Ecommerce | 29.81% | 1.74% | 0.19% |
| All Industries (avg.) | 35.63% | 2.62% | 0.22% |
Source: industry email benchmark data, 2026. Figures may be updated periodically as provider data refreshes.
Ecommerce sits a little below the all-industry average on both these numbers, and that’s expected. A promotional email is competing against dozens of other promotional emails in the same inbox. People act when the offer fits them, not just because a subject line was clever. Don’t chase a non-profit’s numbers with a 20% off code. Chase your own store’s trend over the last few months instead. That’s the comparison that actually tells you something.
Open Rate: What’s Realistic in 2026
Open rate is the percentage of people who opened your email. For ecommerce, 15% to 25% is healthy for regular promotional sends, while welcome emails and post-purchase emails often climb past 40% because people genuinely expect those.
One thing worth knowing for 2026: Apple’s Mail Privacy Protection can register an email as “opened” the moment it’s pre-fetched, even if a human never actually looked at it. So that number might look a bit rosier than real attention actually is. Treat it as a directional signal, not gospel, and always read it next to your click rate.
Why Domain Setup Quietly Wrecks Open Rate
A lot of store owners never realize this, but poor domain authentication kills how many people see your email before your subject line even gets a chance. Senders without proper SPF, DKIM, and DMARC records land in spam far more often than fully authenticated senders, no matter how good the email is.
Adflipr lets you connect your own domain through providers like GoDaddy or Cloudflare, which protects deliverability and keeps your numbers honest over time, since the email actually has to land in the inbox before anyone can open it.
Real example: A Shopify skincare brand swapped “20% Off Sale” for “We almost didn’t ship this one.” Open rate moved from 9% to 22% in three sends. Same list, same product, just a subject line that respected curiosity over discount fatigue.
Click Through Rate and the Metric Most Stores Skip
Click through rate (CTR) is the percentage of everyone who received the email and clicked something. A solid CTR for ecommerce sits between 2% and 5%.
But here’s the metric almost nobody tracks separately: click to open rate, or CTOR. This only measures clicks among people who already opened the email. It strips out the subject line entirely and tells you something cleaner, whether your actual content and offer convinced someone once they were already looking at it.
If your open rate looks fine but CTOR is weak, the subject line isn’t the problem. The email itself is.
WooCommerce example: A home decor brand had five competing links crammed into one email. They cut it down to a single, obvious “Shop Now” button. CTR jumped almost 60%, simply because people weren’t confused about where to click anymore. Building a clean layout like that is much easier with a drag-and-drop email builder than fighting with code every time.
Shopify example: A clothing brand sent the same generic “New Arrivals” email to their entire list and got a flat 1.8% CTR. Once they segmented it by gender and past purchase category using their contact management data, CTR climbed to 4.3%. Same products, just sent to the right people.
Conversion Rate: Where Clicks Either Turn Into Sales or Don’t
Conversion rate tells you how many people who clicked actually bought something. A healthy ecommerce conversion rate sits between 2% and 5%.
If clicks are strong but conversions are weak, the issue is almost never the email. It’s what happens after the click:
- A product page that loads too slowly
- A checkout flow with too many steps
- A landing page that doesn’t match what the email promised
The Fastest Fix for a Conversion Gap
Make sure the email and the landing page tell the exact same story. If the email says 20% off red sneakers, the page someone lands on should show that offer immediately, not a generic homepage they have to dig through to find what was promised.
Revenue Per Email: The Number That Actually Pays Your Bills
Open rate and click rate are useful, but revenue per email is the one that tells you what your list is actually worth. Calculate it by dividing total campaign revenue by the number of emails sent.
This number exposes something most store owners never notice: automated, behavior-triggered emails often make up a small slice of total sends but generate a disproportionate share of revenue, because they catch someone at the exact moment they’re already thinking about buying. A broadcast to your whole list rarely beats that kind of timing.
This is exactly why Adflipr’s automation workflows are built around measurable revenue per journey, not just send volume. Once you can see which flow is quietly paying for itself, you know where to put your attention.
List Growth Rate and Unsubscribe Rate
A healthy list grows 2% to 5% a month through organic signups, popups, and checkout opt-ins. Unsubscribe rate should stay close to the ecommerce benchmark of roughly 0.19% per send.
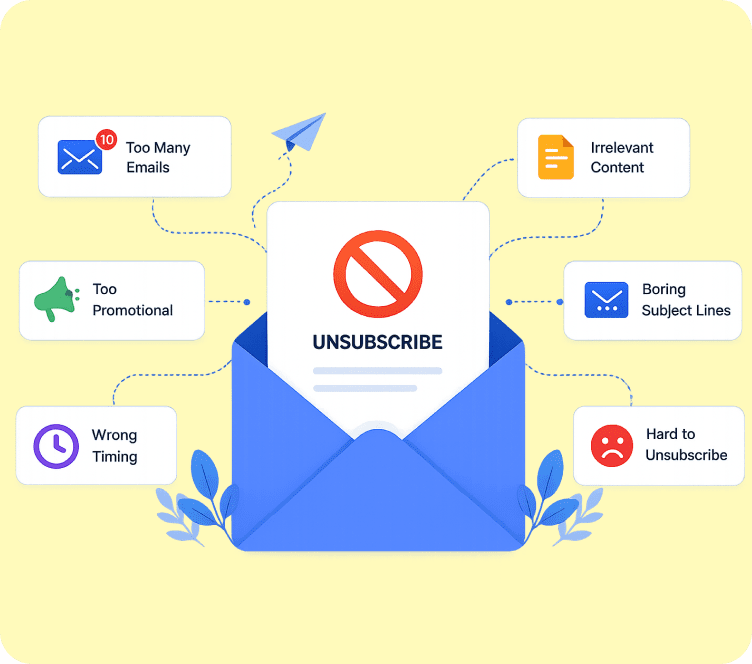
If unsubscribes start creeping up, it’s usually one of three things:
- You’re emailing too often
- The content doesn’t match what people signed up for
- Your list is full of old, disengaged contacts who were never going to buy again
A smaller, genuinely engaged list will beat a large, half-asleep one on every single metric in this article.
Abandoned Cart Recovery Rate, the Metric Shopify and WooCommerce Stores Can’t Afford to Ignore
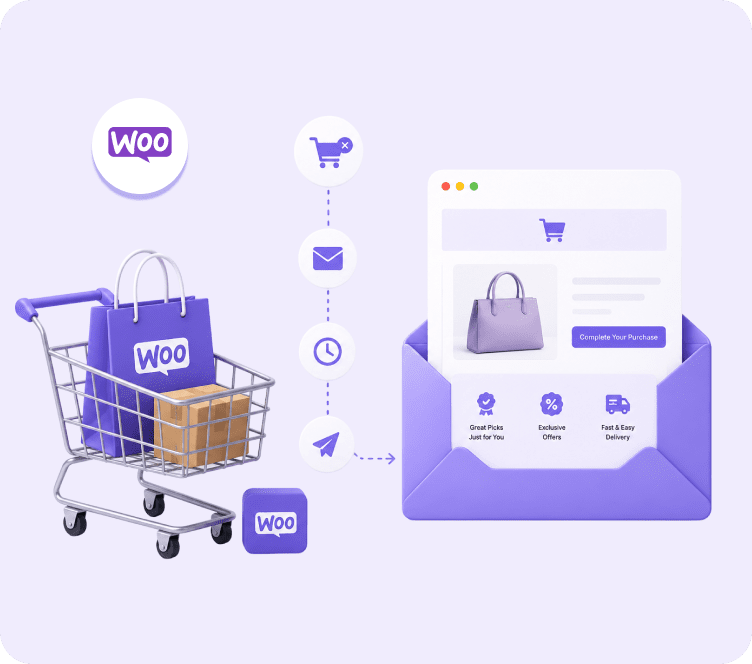
About 70% of online carts get abandoned before checkout. That’s not a small leak, that’s most of your potential sales walking away. A well-built recovery sequence can win back 10% to 15% of those lost carts, which is exactly why this number deserves its own tracking, separate from your regular campaigns.
Shopify Example
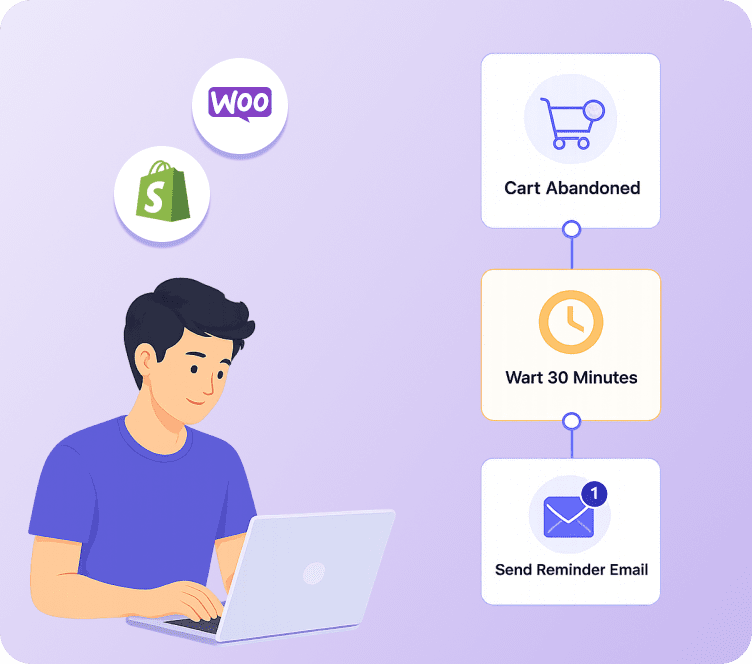
A Shopify jewelry store ran a simple three-email sequence: one hour after abandonment, twelve hours later with a small incentive, and a final reminder at twenty-four hours. That sequence alone recovered 13% of abandoned carts, with zero extra ad spend.
WooCommerce Example
A WooCommerce supplement brand switched from a fixed-delay reminder to Adflipr’s abandoned cart recovery automation, which triggers off real-time cart activity instead. Recovery rate climbed from 8% to nearly 12%, because the email reached the shopper while they were still actually thinking about the purchase, not a day later when the moment had passed.
Best Practices That Actually Move These Numbers
- Clean your list every few months so dead contacts stop dragging your averages down
- Segment by what people actually buy, not just who they are
- Test subject lines on a small slice of your list before sending to everyone
- Design for mobile first, since that’s where most ecommerce opens happen
- Use one clear call to action instead of five links competing for attention
- Always look at flows and campaigns separately, never blended together in one report
Both Shopify and WooCommerce integrations with Adflipr sync your order and customer data automatically, so these metrics start building accurately from day one instead of needing manual setup work first.
Mistakes That Quietly Sabotage Good Stores
- Watching open rate and nothing else. It tells you almost nothing about revenue by itself.
- Comparing against the wrong industry. Use the benchmark table above, not a flat global number.
- Skipping click to open rate entirely. It’s the cleanest signal that your content, not your subject line, needs work.
- Mixing flows and campaigns in the same report. Automated flows usually outperform broadcasts by a wide margin, and blending them hides which one is actually carrying your revenue.
- Ignoring unsubscribe and spam complaint rates. These protect your sender reputation long after this month’s campaign is forgotten.
Conclusion
Email marketing metrics only start making sense once you stop measuring yourself against a flat average and start measuring against the right industry benchmark, your own past performance, and how your automated flows stack up against your one-off campaigns. Open rate, click to open rate, conversion rate, revenue per email, and abandoned cart recovery rate together tell you exactly where the money is sitting and exactly where it’s leaking out.
If you’re ready to actually act on these numbers instead of just watching them, Adflipr is built specifically to turn this kind of data into real revenue for Shopify and WooCommerce stores. Check out pricing here to see which plan fits where your store is right now.
FAQ
What are email marketing metrics?
These are data points like open rate, click through rate, click to open rate, conversion rate, and revenue per email. Together they show whether your campaigns are genuinely driving sales or just sitting unread in someone’s inbox.
What is a good email marketing benchmark for ecommerce in 2026?
Ecommerce open rates typically run near 29.81%, with click rates around 1.74%, both slightly below the all-industry average. That’s normal, since ecommerce emails depend on offer relevance more than general curiosity.
Why is click to open rate more useful than click through rate alone?
Click to open rate only looks at people who already opened the email, so it isolates whether your content and offer are convincing once someone is actually reading, separate from whatever pulled them in through the subject line.
Why does revenue per email matter more than open rate?
Open rate shows curiosity. Revenue per email shows money. A campaign can have a modest open rate but a strong revenue per email if the people who do open it are genuinely ready to buy.
What mistakes should I avoid when tracking metrics?
Avoid relying only on open rate, comparing against the wrong industry, skipping click to open rate, blending automated flows with one-off campaigns, and ignoring unsubscribe and spam complaint rates.
Is tracking email marketing metrics worth it for small Shopify stores?
Yes. Even small stores lose real money to abandoned carts and weak segmentation, and tracking these metrics shows exactly where that money is slipping away.
Does this apply to WooCommerce stores too?
Yes, the same metrics and benchmarks apply. WooCommerce stores benefit just as much from tracking abandoned cart recovery rate and revenue per email as Shopify stores do.
How often should I check my email marketing benchmarks?
Check at least once a month, and always look at automated flows separately from one-off campaigns, since they tend to perform very differently and need different fixes.
How does Adflipr help improve these metrics?
Adflipr connects directly to Shopify and WooCommerce, syncs customer and order data automatically, and ties campaign performance back to actual revenue instead of just opens and clicks. Its abandoned cart recovery and automation workflows are built to act on exactly the metrics covered in this guide.